Last Updated on 26 April, 2026 by Yieldova
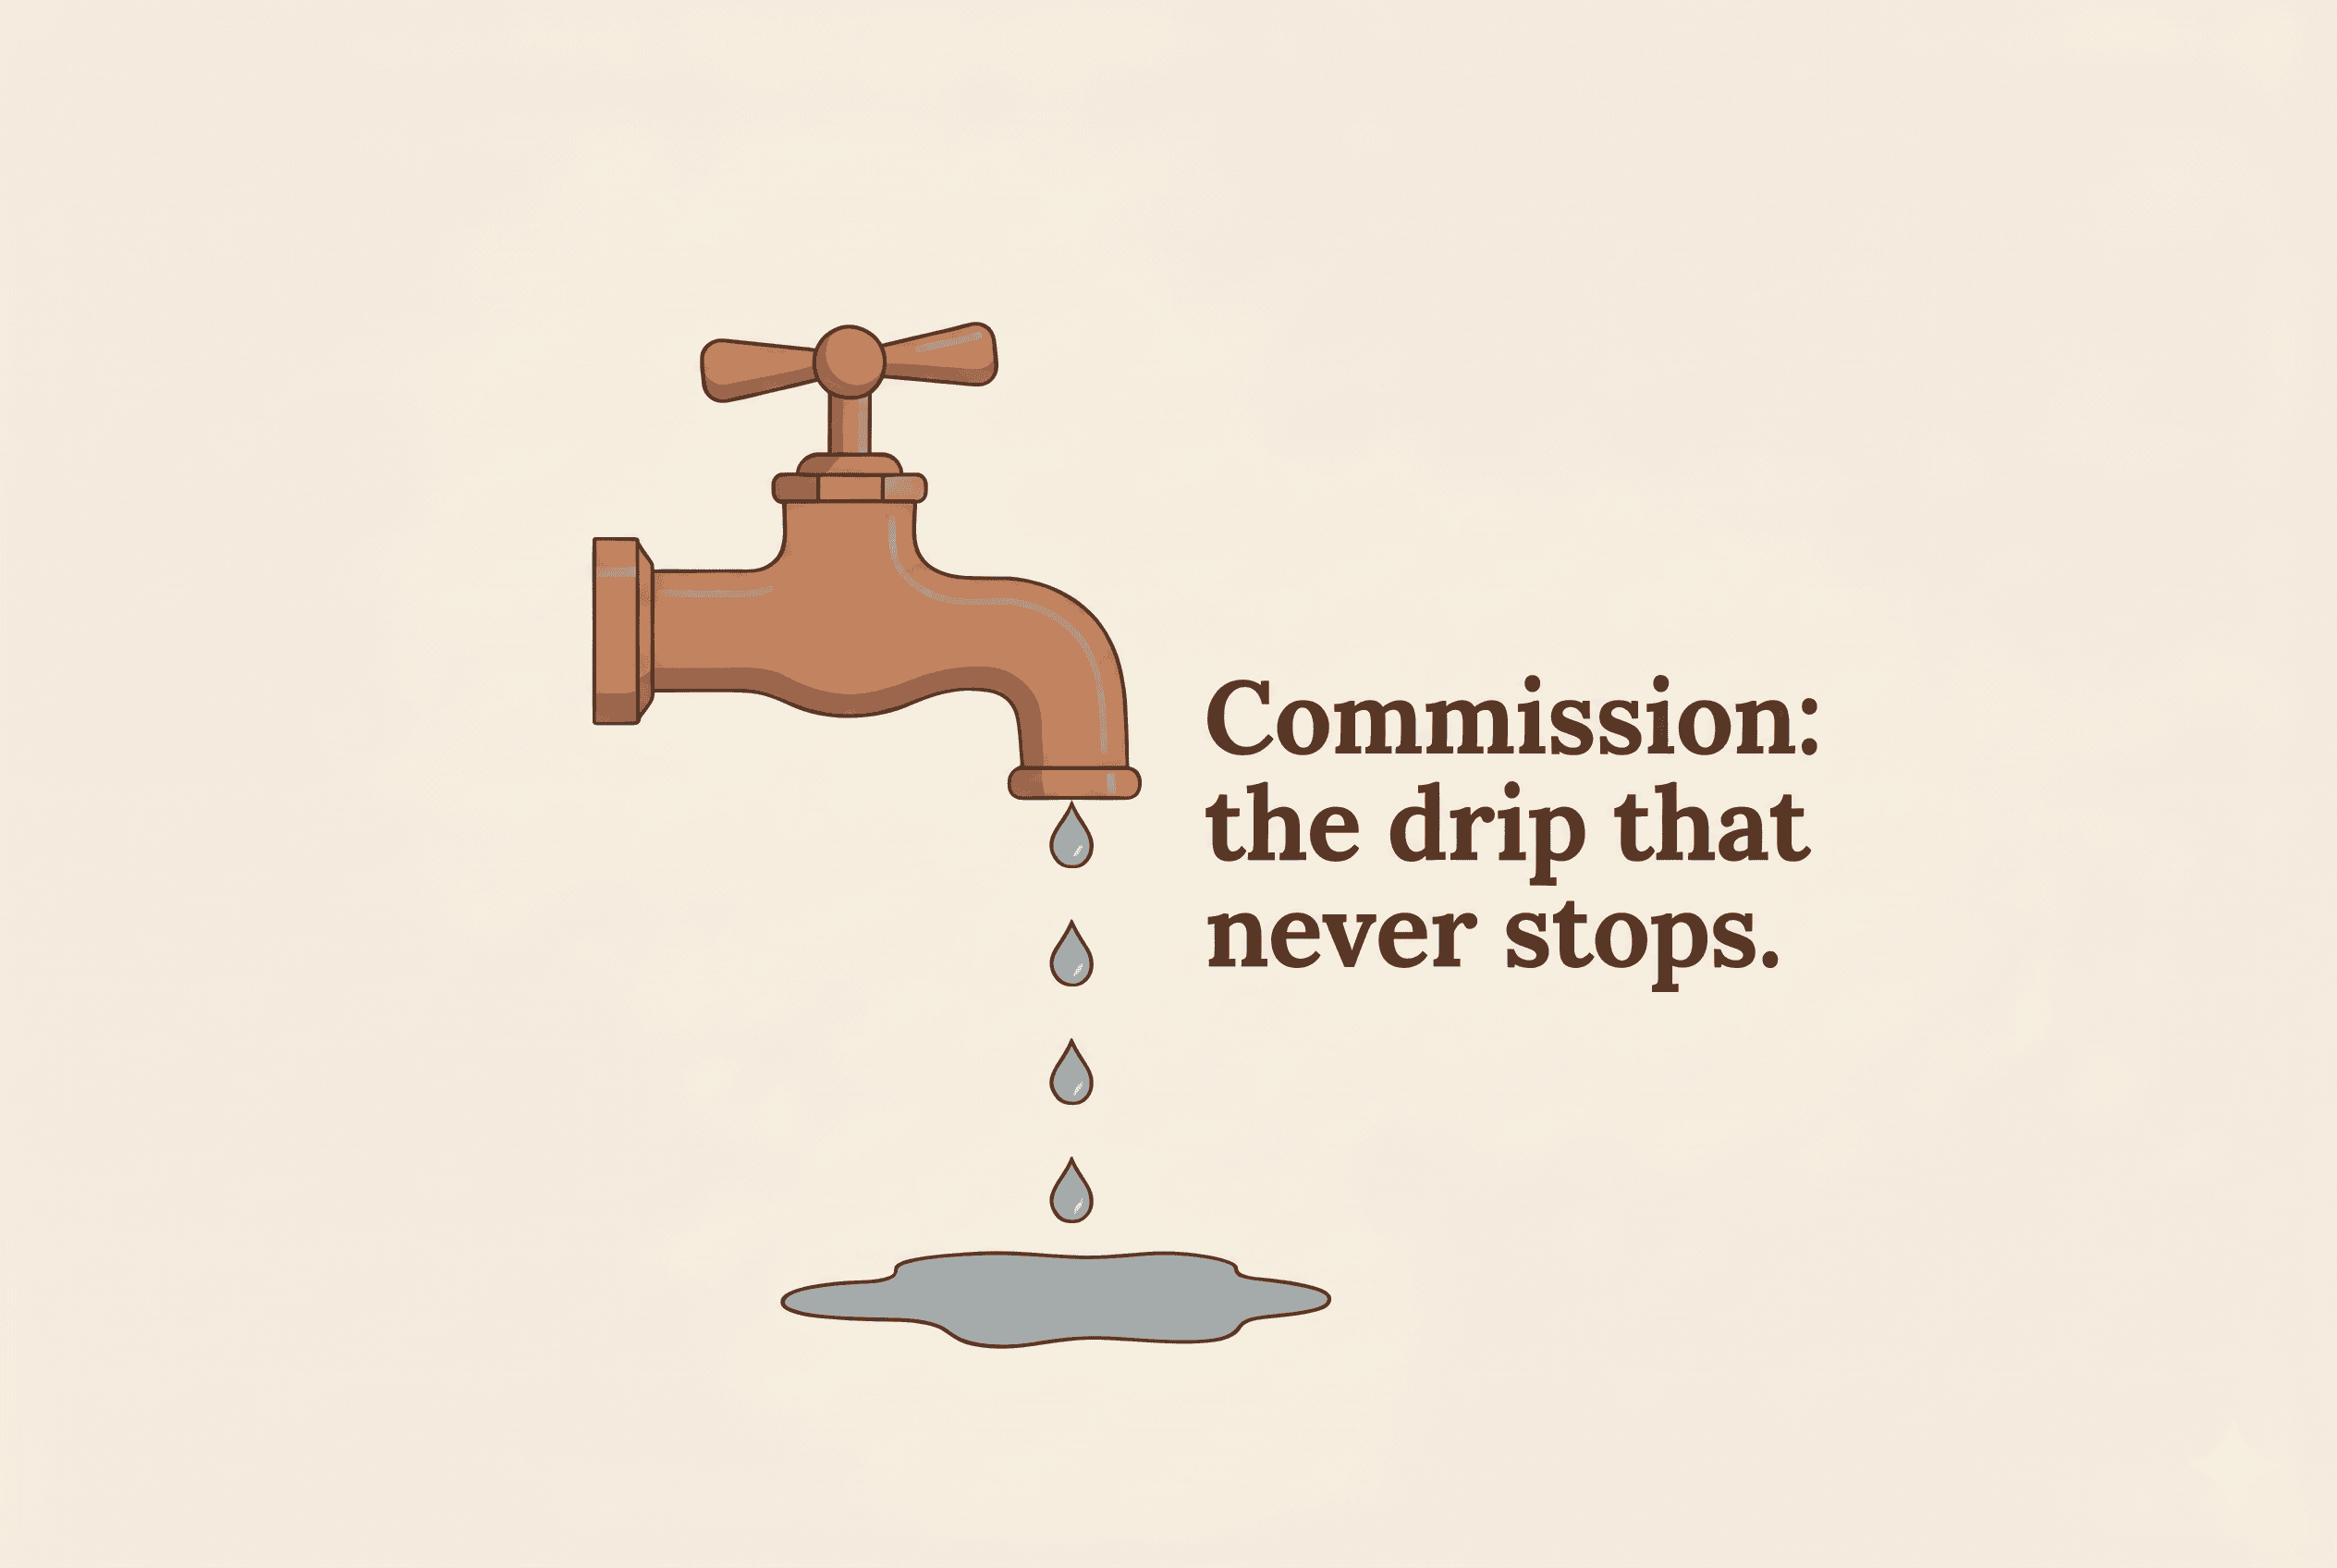
A 0.04% commission feels like nothing. Paid 500 times a year, it’s the difference between a profitable strategy and a break-even one.
The Cost That Feels Negligible Until It Isn’t
Of all the execution costs in trading, commissions are the most transparent. Unlike slippage or spread, they appear explicitly on your trade confirmation. You know exactly what you paid. That transparency creates a false sense of control — because while the per-trade cost is visible, the cumulative annual cost and its impact on your strategy’s edge is rarely calculated.
A trader running 500 trades per year at $10,000 per position with a 0.04% taker fee pays $20,000 annually in commissions alone. If the strategy generates $30,000 in gross profit, commissions consume two-thirds of it before slippage, spread, or any other cost is accounted for. The math is straightforward — but most traders never run it explicitly before committing to a strategy and a broker.
Commissions compound against you in a way that’s different from the other execution costs. Slippage and spread vary with market conditions. Commissions are fixed and certain — paid on every trade regardless of whether it wins or loses, regardless of market conditions, regardless of how well your strategy is performing. In a drawdown, you’re paying commissions on losing trades. That certainty makes them the most insidious drag on a high-frequency strategy’s returns.
How Commission Structures Work
Commission structures vary significantly across asset classes and broker types. Understanding the structure you’re paying is the prerequisite for calculating its real cost.
Percentage of trade value — the most common structure in crypto and some equity brokers. A fixed percentage applied to the notional value of each trade. Simple to calculate, scales with position size.
Commission = Position size × Commission rate
Example: $10,000 × 0.04% = $4 per trade
Maker vs taker fees — prevalent in crypto and some futures markets. Maker fees apply when you add liquidity to the order book by placing a limit order that doesn’t immediately fill. Taker fees apply when you remove liquidity with a market order or a limit order that fills immediately. Maker fees are typically lower — sometimes zero or even negative (rebates) — because market makers provide a service to the exchange. Taker fees are higher because you’re consuming liquidity.
Typical crypto exchange structure:
Maker fee: 0.02%
Taker fee: 0.04%

A strategy using exclusively market orders pays taker fees on every trade.
A strategy using limit orders pays maker fees — or earns rebates.
Fixed fee per trade — common in traditional equity and futures brokers. A flat dollar amount per trade or per contract regardless of size. Favorable for large positions, punishing for small ones.
Fixed fee: $5 per trade
On $1,000 position:  $5 = 0.50% effective rate
On $10,000 position: $5 = 0.05% effective rate
On $50,000 position: $5 = 0.01% effective rate
Spread-based compensation — common in retail forex and CFD brokers. The broker takes no explicit commission but instead widens the spread. The commission is embedded in the price you receive rather than charged as a separate fee. This structure makes the real cost less visible but not lower — often higher than an equivalent commission-based broker.
ℹ The hidden cost of spread-based brokers
Brokers that advertise “zero commission” typically compensate through spread markup. A forex broker offering EUR/USD at a 2-pip spread when the interbank rate is 0.5 pips is charging you 1.5 pips of implicit commission on every round trip. This is not cheaper than an explicit commission — it’s just less visible. Always calculate the total cost of a round trip including all implicit and explicit fees before comparing brokers.
The Math: How Commissions Compound Against Your Edge
The impact of commissions on strategy performance is best understood as a reduction in per-trade edge. Every commission paid is edge consumed — permanently, on every trade, regardless of outcome.
Net edge per trade = Gross edge − Round-trip commission cost

Example:
Gross edge per trade:    0.30%
Round-trip commission:   0.08% (entry + exit)
Net edge per trade:      0.22%

Commission consumes 26.7% of gross edge
Now scale across a full year:
Strategy profile:
Trades per year:     600
Average position:    $10,000
Gross edge:          0.30% per trade
Commission rate:     0.04% per side (0.08% round trip)

Annual gross profit:  600 × $10,000 × 0.30% = $18,000
Annual commission:    600 × $10,000 × 0.08% = $4,800
Annual net profit:    $13,200

Commission as % of gross: 26.7%
Now increase trade frequency — a common response when a strategy’s edge seems thin and traders compensate by trading more:
Same strategy, 1,200 trades per year:
Annual gross profit:  1,200 × $10,000 × 0.30% = $36,000
Annual commission:    1,200 × $10,000 × 0.08% = $9,600
Annual net profit:    $26,400

Commission as % of gross: still 26.7%
The ratio stays constant — but the absolute commission cost doubles. More trades means more commission, proportionally. The only way to improve the commission ratio is to either reduce the commission rate or increase the per-trade edge. Increasing frequency doesn’t help.
↯ The frequency trap
When a strategy underperforms expectations, a common instinct is to increase trade frequency — more trades means more opportunities to recover. But if the underperformance is driven by execution costs, more trades means more commission, more slippage, more spread. The problem compounds rather than resolves. More frequency is only the answer if the per-trade edge is genuinely positive after all costs — and if it is, you didn’t need more frequency to begin with.
Commission Impact by Strategy Type
The damage commissions cause is directly proportional to trade frequency and inversely proportional to per-trade edge. Different strategy types have very different commission sensitivities.
High-frequency and scalping strategies — most vulnerable to commissions. Target edges of 0.05-0.15% per trade on 500-2000+ annual trades. At these edge levels, a 0.08% round-trip commission can consume 50-100% of the gross edge. These strategies are only viable with maker fee structures, commission rebates, or institutional-level fee tiers.
Systematic intraday strategies — moderately sensitive. Target edges of 0.20-0.50% per trade on 200-800 annual trades. At these levels, a 0.08% commission consumes 16-40% of the gross edge. Viable with standard taker fees but significantly improved with maker order routing.
Swing trading strategies — least sensitive. Target edges of 0.5-2%+ per trade on 50-200 annual trades. At these levels, commissions are a minor fraction of the gross edge and rarely the determining factor in strategy viability.
Position trading and investing — commission is essentially irrelevant as a percentage of returns when holding periods are measured in months or years and per-position returns are measured in tens of percent.
Maker vs Taker: The Most Underused Optimization
For systematic strategies that can control order type, the difference between maker and taker fees is one of the highest-leverage optimizations available — and one of the most consistently underutilized.
On a major crypto exchange, the difference between maker and taker fees is typically 0.02-0.04% per side. On a round trip, that’s 0.04-0.08% — which on a strategy with a 0.30% gross edge represents 13-27% of total edge. Converting a taker-dominated strategy to a maker-dominated one — by entering on limit orders that rest in the book rather than market orders that fill immediately — can materially improve net returns without changing the strategy’s signal logic at all.
The tradeoff is fill certainty. A limit order that doesn’t fill means a missed trade. Whether missed trades are better or worse than taker fees depends on the strategy — a strategy where missing 10% of trades has minimal impact on overall performance benefits significantly from maker order routing. A strategy where every signal is critical cannot afford missed fills.
Commission comparison — 600 trades, $10,000 average position:

All taker (0.04% per side):
Annual commission: 600 × $10,000 × 0.08% = $4,800

All maker (0.02% per side):
Annual commission: 600 × $10,000 × 0.04% = $2,400

Annual saving: $2,400 — with no change to signal logic
Fee Tiers and Volume Discounts
Most exchanges and brokers offer tiered fee structures where higher trading volume unlocks lower commission rates. Understanding where you sit in the fee tier structure — and how far you are from the next tier — is relevant for systematic traders with meaningful volume.
On major crypto exchanges, fee tiers are typically based on 30-day trading volume. A trader doing $500,000 per month in volume might pay 0.04% taker; at $5,000,000 per month, the same exchange might charge 0.02%. At scale, that difference has the same impact as the maker/taker optimization above — significant annual savings with no change to strategy logic.
For traders not yet at volume-discount thresholds, the practical options are to consolidate trading activity onto fewer exchanges to concentrate volume, or to use exchanges with flat low-fee structures rather than tiered ones.
How to Calculate Your Real Annual Commission Cost
Before evaluating any strategy, calculate the full annual commission cost explicitly:
Step 1 — Determine your round-trip commission rate:
Round-trip rate = Entry commission + Exit commission
(For maker/taker: use weighted average based on your order mix)

Step 2 — Calculate annual commission:
Annual commission = Trades per year × Average position size × Round-trip rate

Step 3 — Calculate commission as % of gross edge:
Commission ratio = Annual commission / Annual gross profit

Step 4 — Evaluate viability:
If commission ratio > 30%: strategy needs higher edge or lower commission
If commission ratio > 50%: strategy is unlikely to survive all execution costs combined
If commission ratio < 15%: commission is not the limiting factor
Run this calculation before backtesting, not after. If the commission math doesn't work at your target trade frequency and position size, the backtest result is irrelevant — you already know the strategy won't survive its execution costs.
✓ The commission rule
Your per-trade edge needs to be at least 3x your round-trip commission cost to leave meaningful margin for slippage, spread, and latency. If your gross edge is 0.10% and your round-trip commission is 0.08%, the strategy has no realistic path to profitability in live trading — 80% of the gross edge goes to commission before any other cost is counted.
Conclusion
Commissions are the most honest of all execution costs — explicit, predictable, and impossible to attribute to bad luck. That honesty makes them easy to calculate and easy to optimize, which is why they're also the most controllable variable in your execution cost structure.
The calculation is simple: multiply your annual trade count by your average position size by your round-trip commission rate. Compare that number to your expected annual gross profit. If commissions alone consume more than 25-30% of your gross edge, you have either a frequency problem, a commission rate problem, or an edge problem — and you need to know which one before putting real capital at risk.
The strategies that survive execution costs are the ones designed with those costs in mind from the start — not as an afterthought, but as a hard constraint that shapes the strategy's timeframe, frequency, and minimum required edge. A strategy built around a 0.30% gross edge with 0.08% round-trip commission has margin to work with. A strategy built around a 0.08% gross edge with the same commission does not, regardless of how clean the backtest looks.
Know your commission cost before you know your backtest result. In that order.
ℹ The complete execution cost series
This is the fourth article in our execution cost series. The full picture of what separates backtest performance from live trading: Slippage, Bid-Ask Spread, Latency and Execution Speed, and this article on commissions. For the broader context: Why Backtested Strategies Fail in Live Markets.
Articles published under the Yieldova byline combine market data, primary sources, and hands-on trading experience. Every piece goes through the same standard: if we wouldn't stake money on it, we don't publish it.