
Last Updated on 25 April, 2026 by Yieldova
One of the oldest patterns in markets. Still working — if you know where to look.
What Is a Gap and Why Does It Happen?
A gap occurs when a stock opens at a significantly different price than where it closed the previous session. On a chart, it appears as a literal empty space — a price range where no trading occurred.
Gaps form because markets don’t sleep, but stocks do. Between the US market close at 4:00 PM and the next day’s open at 9:30 AM, a lot can happen: earnings reports, analyst upgrades or downgrades, sector news, macroeconomic data, or simply sentiment shifts driven by futures and pre-market activity. By the time the market opens, buyers and sellers have already repriced the stock — sometimes dramatically.
The key question gap traders ask is simple: will the price come back to fill that empty space, or will it keep going in the same direction?
The Four Types of Gaps
Common gaps — small, frequent gaps with no significant catalyst behind them. They occur in normal trading conditions and tend to fill quickly, often within the same session or the next few days. These are the bread and butter of gap fill strategies.
Breakaway gaps — gaps that occur at the end of a consolidation period, signaling the start of a new trend. They’re accompanied by high volume and represent a genuine change in market sentiment. Breakaway gaps often don’t fill — or fill much later.
Runaway gaps (continuation gaps) — gaps that occur in the middle of a strong trend, confirming momentum. Like breakaway gaps, they tend not to fill quickly. Trading against them is dangerous.
Exhaustion gaps — gaps that appear near the end of a trend, often accompanied by high volume and a reversal shortly after. These tend to fill relatively quickly as the trend loses steam.
ℹ Key distinction
Gap fill strategies work best on common gaps and exhaustion gaps. Breakaway and runaway gaps are driven by fundamental shifts in sentiment and often don’t fill — trading against them is one of the fastest ways to lose capital.
Which Assets Work Best for Gap Fill Trading
Not every stock is a good candidate for gap fill strategies. The assets that work best share a specific set of characteristics:
High average daily volume — liquidity is non-negotiable. You need to be able to enter and exit positions without significant slippage. Stocks with less than 500,000 shares traded per day are generally too illiquid for this approach.
Regular earnings catalysts — stocks with quarterly earnings that consistently move the price create a steady supply of tradeable gaps. The more catalysts, the more opportunities.
High volatility — gap fill strategies need gaps large enough to be worth trading after accounting for spreads and commissions. Stocks that barely move between sessions rarely generate actionable setups.
Tendency to mean-revert — some stocks consistently overreact to news and then retrace. This behavioral pattern — driven by retail panic or euphoria — is what the gap fill strategy exploits. Not all stocks behave this way.
Active options market — not strictly necessary, but stocks with active options tend to have more institutional attention, which contributes to more orderly price behavior and better gap fill rates.
✓ Practical filter
A minimum gap size filter is essential. Gaps below 1% are often noise — too small to generate meaningful profit after friction costs. Setting a minimum threshold eliminates the weakest setups and keeps the strategy focused on genuine opportunities.
Why Gap Fill Works: The Real Edge
Showing that a strategy has positive backtest results is one thing. Explaining why it works is another — and it’s the difference between a strategy you can trust and one you’ll abandon the first time it hits a losing streak.
Gap fill has a genuine structural edge. It’s not random. Here’s what’s actually driving the results:
Overnight overreaction — pre-market trading happens with thin liquidity and disproportionate retail participation. When news breaks after the close, the initial price reaction tends to overshoot the rational equilibrium. Retail traders react emotionally; institutions are mostly absent. By the time the regular session opens, the price has moved further than the news actually warrants. The regular session corrects that excess — which is the gap filling. Lou, Polk, and Skouras (2019) documented this pattern systematically across US equities, finding that overnight returns driven by retail activity tend to reverse during the following regular session.
Liquidity imbalance at the open — in the first minutes after the open, market makers widen spreads and rebalance their books. There’s a temporary imbalance between supply and demand that creates artificial short-term momentum in the direction of the gap. This is precisely why the strategy waits 3 candles before entering — it lets the initial chaos settle and enters once the liquidity imbalance starts to resolve rather than amplify. Berkman, Koch, Tuttle, and Zhang (2012) showed that retail attention-driven buying at the open pushes prices beyond fundamental value, creating predictable short-term reversals in the opening minutes of trading.
Institutional rebalancing pressure — funds and large traders with existing positions in a stock need to rebalance when the price gaps. A fund that was long COIN at $180 and woke up to a $170 open needs to decide: add at the lower price or reduce exposure? This institutional rebalancing creates consistent pressure against the gap direction, especially in liquid, institutionally-held stocks like COIN and OKTA.
ℹ The edge in one sentence
Overnight gaps in liquid stocks tend to overshoot because pre-market is driven by low-liquidity emotional reaction. The regular session — with full participation and institutional presence — corrects that overshoot. The gap fill strategy systematically captures that correction.
My Experience Trading Gap Fill: 5 Stocks
I’ve been running this strategy systematically since 2022 — a period that includes the 2022 bear market, the 2023 recovery, and the 2024-2025 bull run. Testing across all three market regimes gives the results more weight than a backtest run only in favorable conditions. What follows are the real backtest results from January 1, 2022 to December 31, 2025 across five stocks I’ve traded with this approach.
The parameters I use for this backtest are illustrative — they’re a reasonable starting point, not a claim that these are universally optimal settings. The goal here is to show how the strategy behaves across different types of stocks, not to present a finished trading system.
Strategy parameters used: Gap minimum 1% · 3 candles wait after open · Take Profit 5% · Stop Loss 2% · Forced close near US market close · Both directions
| Stock | Total trades | Win rate | Max drawdown | Profit factor | P&L |
|---|---|---|---|---|---|
| UPST | 626 | 36.10% | 31.20% | 1.124 | +97.97% |
| CCL | 476 | 47.90% | 19.49% | 1.243 | +100.40% |
| COIN | 666 | 40.39% | 20.90% | 1.148 | +113.49% |
| FCEL | 562 | 35.59% | 28.27% | 1.113 | +79.85% |
| OKTA | 165 | 41.82% | 9.35% | 1.499 | +90.51% |
ℹ Before reading the results
The results above assume clean execution at the signal price. In practice, your real results will depend on several factors that vary by setup:
- Slippage — how far your actual fill is from the signal price. On liquid stocks like COIN this is minimal, but on FCEL it can be significant, especially on gap days with volatile opens.
- Broker execution speed — a 200-500ms delay on a 1-minute strategy changes everything. Not all brokers are equal.
- The charting platform and signal system you use — TradingView’s strategy tester assumes instant execution. If you’re running signals through a third-party automation tool, add latency to your mental model.
- Commission structure — at 666 trades per year on COIN, even a 0.01% difference in commission has meaningful compounding impact.
We test and review the brokers and tools that matter for this type of strategy — see our exchange reviews, broker reviews (coming soon), and trading tools.
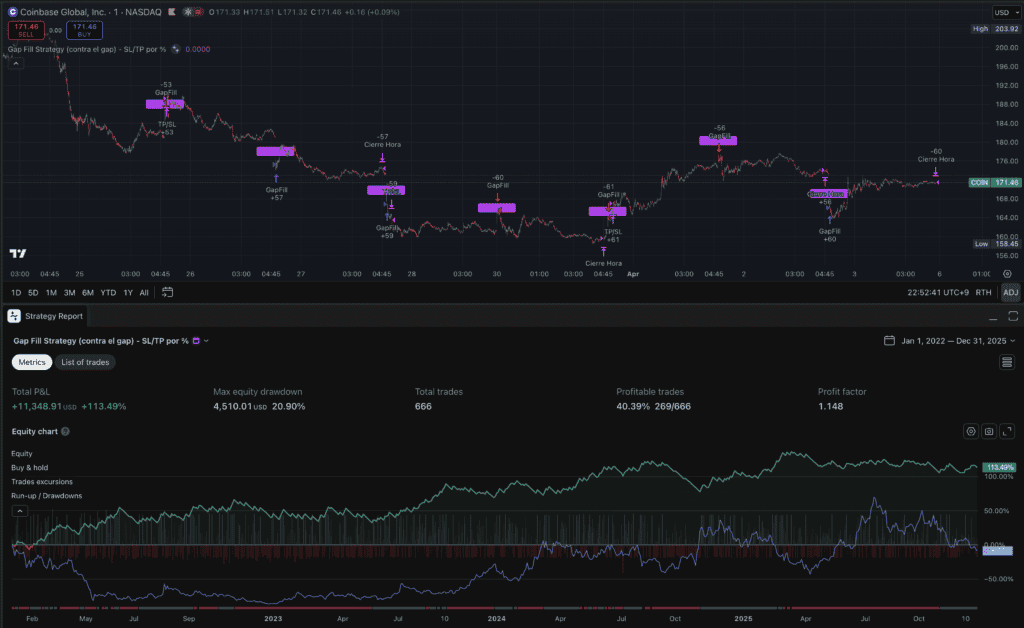
Coinbase (COIN)
COIN is one of the most gap-prone stocks in the US market. As a publicly listed crypto exchange, it moves with Bitcoin and Ethereum overnight — which means almost every morning opens at a different price than where it closed. The gap fill rate is high because the moves are often driven by crypto sentiment rather than COIN-specific fundamentals, and sentiment tends to normalize during the regular session.
Over the four-year backtest period, the strategy generated 666 trades with a 40.39% win rate and a profit factor of 1.148, returning +113.49% on a 20.90% maximum drawdown. The low win rate is expected — with a 2.5:1 reward-to-risk ratio, the strategy doesn’t need to be right most of the time to be profitable.
Over the same period, buying and holding COIN returned -8.77% — essentially flat, with significant volatility along the way. The gap fill strategy returned +113.49% on the same stock, trading the same price action but capturing the directional overreactions rather than sitting through them.
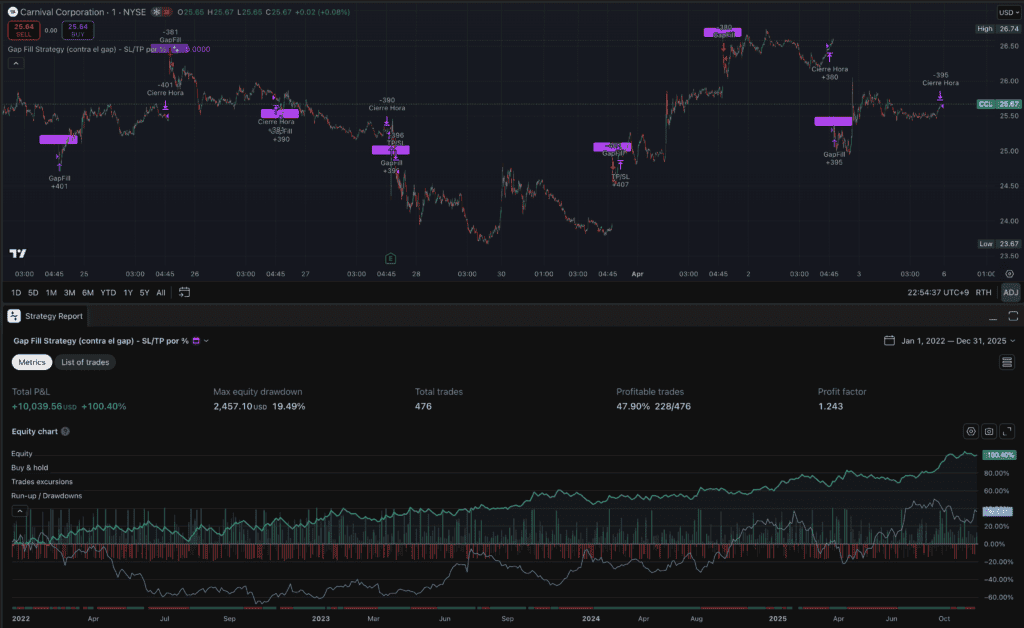
Carnival Corporation (CCL)
CCL is a different type of gap stock. As a cruise line, it’s sensitive to macro news — fuel prices, consumer sentiment, travel restrictions — that often breaks overnight. It’s also a stock with a large retail following, which tends to amplify gaps through emotional overreaction. The gap fill rate on CCL is strong because the overnight moves are frequently disproportionate to the actual news.
The backtest shows 476 trades with a 47.90% win rate — the highest of the five stocks — and a profit factor of 1.243, returning +100.40% on a 19.49% maximum drawdown. The higher win rate reflects CCL’s stronger tendency to mean-revert after gaps.
Buy and hold on CCL returned +36.53% over the four-year period — a decent result for a passive approach. The gap fill strategy returned +100.40%, nearly tripling the buy-and-hold return while operating with a maximum drawdown of 19.49% versus the much larger drawdowns CCL experienced during its worst periods.
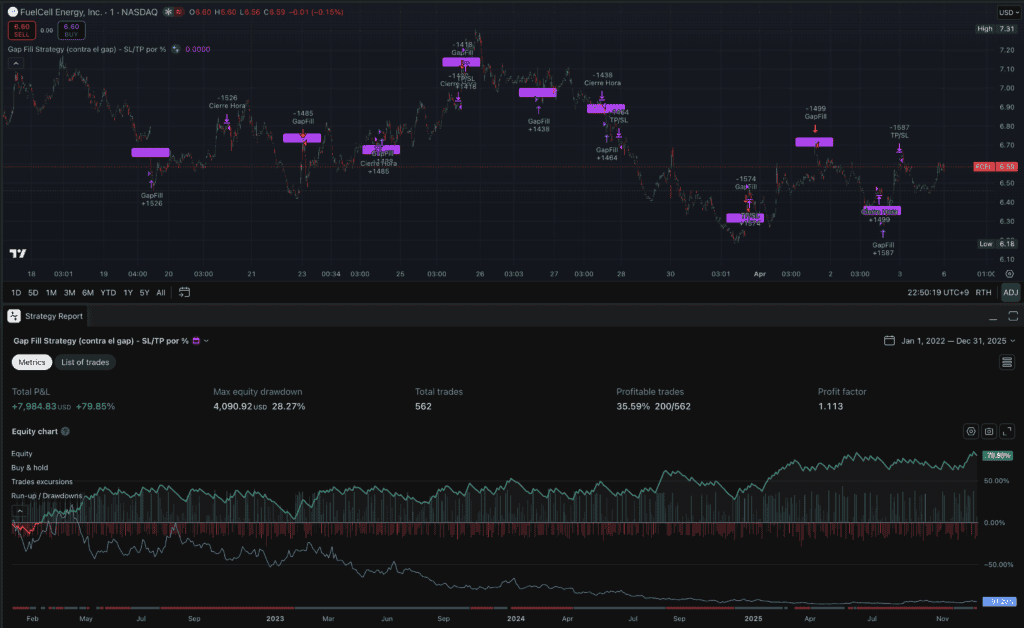
FuelCell Energy (FCEL)
FCEL is a high-risk, high-volatility small cap in the clean energy space. It gaps frequently and aggressively — often 5-10% overnight on minimal news. This creates abundant opportunities but also more noise.
The backtest shows 562 trades with a 35.59% win rate and a profit factor of 1.113, returning +79.85% on a 28.27% maximum drawdown. The higher drawdown reflects FCEL’s inherent volatility — the strategy works, but it’s a rougher ride than the other stocks.
This is where the contrast is most striking. Buy and hold on FCEL returned -94.20% over the same period — a near total loss. The gap fill strategy returned +79.85% on the same stock. Same ticker, same four years, completely opposite outcomes. The strategy doesn’t need the stock to go up — it captures the daily overreactions regardless of the long-term trend.
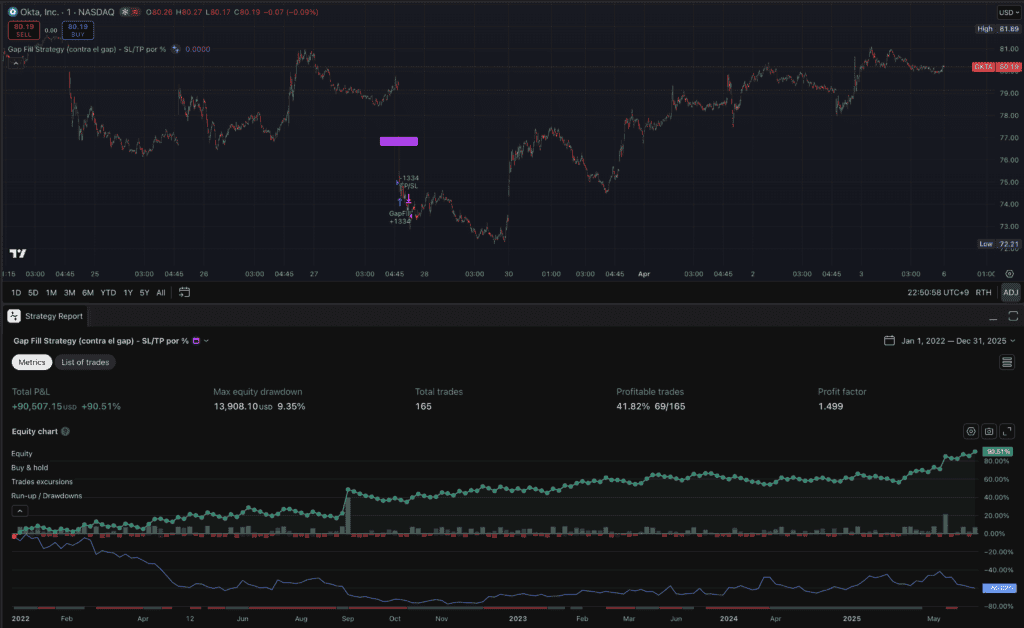
Okta (OKTA)
OKTA is the most interesting result in this set. As a cybersecurity SaaS company, it gaps heavily around earnings and sector news — but it generates far fewer gaps than the other stocks, resulting in only 165 trades over four years. What it lacks in frequency, it makes up for in quality.
The backtest shows a 41.82% win rate, a profit factor of 1.499 — the best of the five — and a maximum drawdown of only 9.35%. The return was +90.51%. The combination of low drawdown and high profit factor suggests OKTA’s gaps are unusually clean — strong overreactions followed by reliable retracements. Fewer trades, better trades.
Buy and hold on OKTA returned -60.02% over the period — a painful result for anyone who held through the tech selloff of 2022-2023. The gap fill strategy returned +90.51% on the same stock, with a maximum drawdown of only 9.35%. The directional trend of the stock was largely irrelevant to the strategy’s performance.
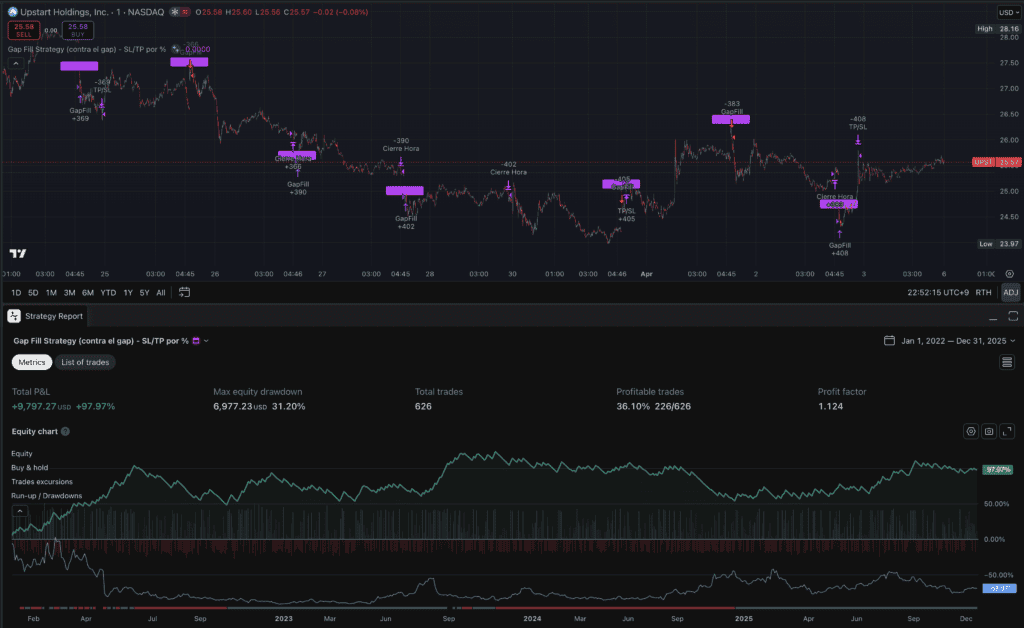
Upstart Holdings (UPST)
UPST is an AI lending company known for extreme earnings volatility. It regularly gaps 20-30% on earnings — which creates large opportunities but also significant risk if the gap continues rather than filling. The strategy handles this through the stop loss, but UPST’s behavior pushes the drawdown limits of the approach.
The backtest shows 626 trades with a 36.10% win rate and a profit factor of 1.124, returning +97.97% on a 31.20% maximum drawdown — the highest of the five. The higher drawdown is the price of trading a stock with UPST’s volatility profile.
Buy and hold on UPST returned -68.97% — a significant loss driven by the stock’s collapse from its 2021 highs. The gap fill strategy returned +97.97% over the same period. The difference illustrates a key advantage of short-term mean reversion strategies: they can generate positive returns on stocks in long-term downtrends, because they’re trading the daily noise, not the trend.
↯ Important context
These are backtested results from January 2022 to December 2025 using fixed parameters across all stocks. Real trading involves slippage, execution delays, and psychological factors that backtests don’t capture. A profitable backtest is a hypothesis, not a guarantee — before risking real capital, validate these results with out-of-sample testing and Monte Carlo simulation.
The Pine Script Code
This is the exact strategy used for the backtests above. Copy it into TradingView’s Pine Script editor and apply it to any 1-minute chart to replicate the results.
//@version=5
strategy("Gap Fill Strategy (contra el gap) - SL/TP por %", overlay=true,
     default_qty_type=strategy.percent_of_equity, default_qty_value=100)

// ========== TIMEZONE SETTINGS ==========
tz       = input.string("Asia/Tokyo", "Timezone",
              options = ["Asia/Tokyo","America/New_York","Europe/London","UTC"])
sessExit = input.session("0445-0450", "Forced close time")

// Forced close flag
inExit   = not na(time(timeframe.period, sessExit, tz))

// ========== DIRECTION SELECTOR ==========
tradeDirection = input.string("Both", "Trade direction",
     options=["Long","Short","Both"])

// ========== GAP PARAMETERS ==========
gapThreshold = input.float(1.0, title="Minimum gap (%)", minval=0.1) / 100
velasEspera  = input.int(5,   title="Candles to wait", minval=1)
tpPerc       = input.float(2.0, title="Take Profit (%)", minval=0.1) / 100
slPerc       = input.float(1.0, title="Stop Loss (%)",  minval=0.1) / 100

// ========== VARIABLES ==========
var float openHoy     = na
var float closeAyer   = na
var float gap         = na
var int   cuentaVelas = 0
var bool  esperando   = false
var float sl          = na
var float tp          = na
var float entryPrice  = na
var int   dir         = 0  // 1 = long, -1 = short

// Detect new daily session
nuevaSesion = ta.change(time("D", tz)) != 0

if nuevaSesion and not na(close[1])
    openHoy     := open
    closeAyer   := close[1]
    gap         := math.abs(openHoy - closeAyer) / closeAyer
    esperando   := gap > gapThreshold
    cuentaVelas := 0
    dir         := 0
    sl          := na
    tp          := na
    entryPrice  := na

// Wait X candles → prepare entry
if esperando
    cuentaVelas += 1
    if cuentaVelas == velasEspera
        dir := openHoy > closeAyer ? -1 : 1   // against the gap
        entryPrice := close
        sl         := entryPrice - dir * (entryPrice * slPerc)
        tp         := entryPrice + dir * (entryPrice * tpPerc)

        // ========== DIRECTION FILTER ==========
        allowedLong  = (tradeDirection == "Both") or (tradeDirection == "Long")
        allowedShort = (tradeDirection == "Both") or (tradeDirection == "Short")

        // Execute only if direction is allowed
        if (dir ==  1 and allowedLong) or (dir == -1 and allowedShort)
            strategy.entry("GapFill", dir > 0 ? strategy.long : strategy.short)
            strategy.exit("TP/SL", from_entry="GapFill", stop=sl, limit=tp)

        esperando := false

// ========== FORCED CLOSE BY TIME ==========
if inExit and strategy.position_size != 0
    strategy.close("GapFill", comment="Time Close")

// Visual gap marker
plotshape(nuevaSesion and gap > gapThreshold,
     location = location.abovebar,
     color    = color.fuchsia,
     style    = shape.labelup,
     text     = "GAP")
How to Use This — And What It Doesn’t Guarantee
To apply this strategy to a new stock, paste the code into TradingView’s Pine Script editor and run it on a 1-minute chart. Start with the default parameters and observe the results before making any changes. Pay attention to the profit factor first — anything below 1.1 on a reasonable sample of trades suggests the stock doesn’t fit this strategy well.
Parameter optimization — the parameters shown here are a starting point. Different stocks respond to different gap thresholds, wait times, and profit targets. OKTA, for example, might benefit from a higher minimum gap threshold given its tendency to generate cleaner, larger gaps. Test variations systematically, not randomly.
When not to trade gaps — avoid this strategy around major macro events (Fed decisions, CPI releases) when gap behavior becomes unpredictable. Also avoid stocks that are in the middle of a sustained directional trend — gaps in trending markets are more likely to be continuation gaps than fill candidates.
Timezone adjustment — the forced close time in the script is set for America/New_York at 16:45-16:50, which aligns with the end of the US regular session. If you’re running TradingView from a different timezone, update the timezone input in the script settings accordingly so the forced close fires at the right time.
⚠ Before trading with real capital
A profitable backtest is a hypothesis, not a guarantee. The results shown here were generated on historical data with fixed parameters — they don’t account for slippage, execution delays, or changing market conditions. Before risking real money, validate this strategy with out-of-sample data and stress-test it with Monte Carlo simulation to understand the real range of possible outcomes. We cover both topics in depth: Why Backtested Strategies Fail in Live Markets and Monte Carlo Simulation for Traders.
References
- Lou, D., Polk, C., & Skouras, S. (2019). “A tug of war: Overnight versus intraday expected returns.” Journal of Financial Economics, 134(1), 192–213. Available at LSE Research Online: https://researchonline.lse.ac.uk/id/eprint/87481/
- Berkman, H., Koch, P. D., Tuttle, L., & Zhang, Y. (2012). “Paying Attention: Overnight Returns and the Hidden Cost of Buying at the Open.” Journal of Financial and Quantitative Analysis, 47(4), 715–741. Available on SSRN: https://ssrn.com/abstract=1625495

I’ve spent years trading crypto futures and building automated arbitrage systems across exchanges. I started Yieldova to share what, in my opinion, actually works in live markets. I’ve had losing streaks, blown strategies, and a few wins worth writing about. Everything here is based on real experience.