Last Updated on 30 April, 2026 by Yieldova
A method born in a nuclear weapons lab. Now the most honest tool a trader can use.
Your Backtest Is Lying to You
You run a backtest. It shows a maximum drawdown of 12%. You size your position accordingly, set your risk limits, and go live.
Three months later, your account is down 28%.
The strategy didn’t fail. The backtest did — but not in the way most traders think.
The issue isn’t overfitting or look-ahead bias (though those matter too — we covered them in detail in Why Trading Strategies That Work in Backtest Fail in Live Markets). The issue is simpler and more fundamental: your backtest shows you exactly one version of history. The specific sequence of wins and losses that happened to occur in that order, on those dates, in that market environment.
But your trades could have occurred in thousands of different orders. And some of those orders would have produced a 28% drawdown — even with the exact same trades.
⚠ The core problem
A backtest with 12% maximum drawdown doesn’t mean your strategy’s real risk is 12%. It means that in that specific historical sequence, the worst run of losses produced a 12% drawdown. Change the order of those same trades and the drawdown could be dramatically different.
This is what Monte Carlo simulation solves.
Where Monte Carlo Comes From
The Monte Carlo method wasn’t invented for trading. It was invented for nuclear weapons.
In the 1940s, mathematicians John von Neumann and Stanislaw Ulam were working on the Manhattan Project at Los Alamos — the secret US program that developed the atomic bomb. They needed to model how neutrons traveled through different materials, a problem too complex to solve with standard equations.
Ulam’s insight: instead of solving the equation directly, run thousands of random simulations and look at the distribution of outcomes. The average of enough random experiments converges on the true answer.
He named the method after the Casino de Monte Carlo in Monaco — where his uncle was known to gamble — because randomness was at the heart of the technique.
The method spread from physics to engineering, finance, and risk management. Today it’s a standard tool at every major bank, hedge fund, and asset manager in the world. And it’s directly applicable to your trading strategy.
What Monte Carlo Actually Does
The concept is straightforward. Instead of analyzing the one historical sequence of your trades, Monte Carlo takes those same trades and reshuffles them randomly — thousands of times.
Each reshuffle is a plausible alternative history. Your strategy had the same win rate, the same average win, the same average loss — but the trades happened in a different order. Some sequences start with a long winning streak and then hit a rough patch. Others start badly and recover. Some produce catastrophic drawdowns early. Others never drawdown more than 5%.
After running 1,000 or 10,000 of these simulations, you have a distribution — not a single number, but a full picture of the range of outcomes your strategy could realistically produce.
ℹ Key concept
Monte Carlo doesn’t predict the future. It maps the full range of possible outcomes given your strategy’s historical edge. The difference between your backtest result and the 95th percentile worst case is the risk you’ve been ignoring.
How to Read the Results
When you run a Monte Carlo simulation on your trade history, you get five key metrics:
Historical drawdown — the maximum drawdown from your actual backtest sequence. This is the number most traders use for risk management. It’s also the least reliable.
Median drawdown — the drawdown that half of all simulations fell below. If this is significantly lower than your historical drawdown, your real sequence was unlucky. If it’s higher, you got lucky.
Worst case at 95% confidence — only 5% of simulations produced a drawdown worse than this number. This is your real risk ceiling. Size your positions based on this number, not the historical drawdown.
Ruin probability — the percentage of simulations where the account fell below 50% of initial capital. A strategy with 0% ruin probability across 1,000 simulations is very different from one with 8% ruin probability — even if both show the same historical drawdown.
Median final equity — the median account value at the end of all simulations. This tells you whether your strategy has genuine positive expectancy or whether your historical profits were a lucky sequence.
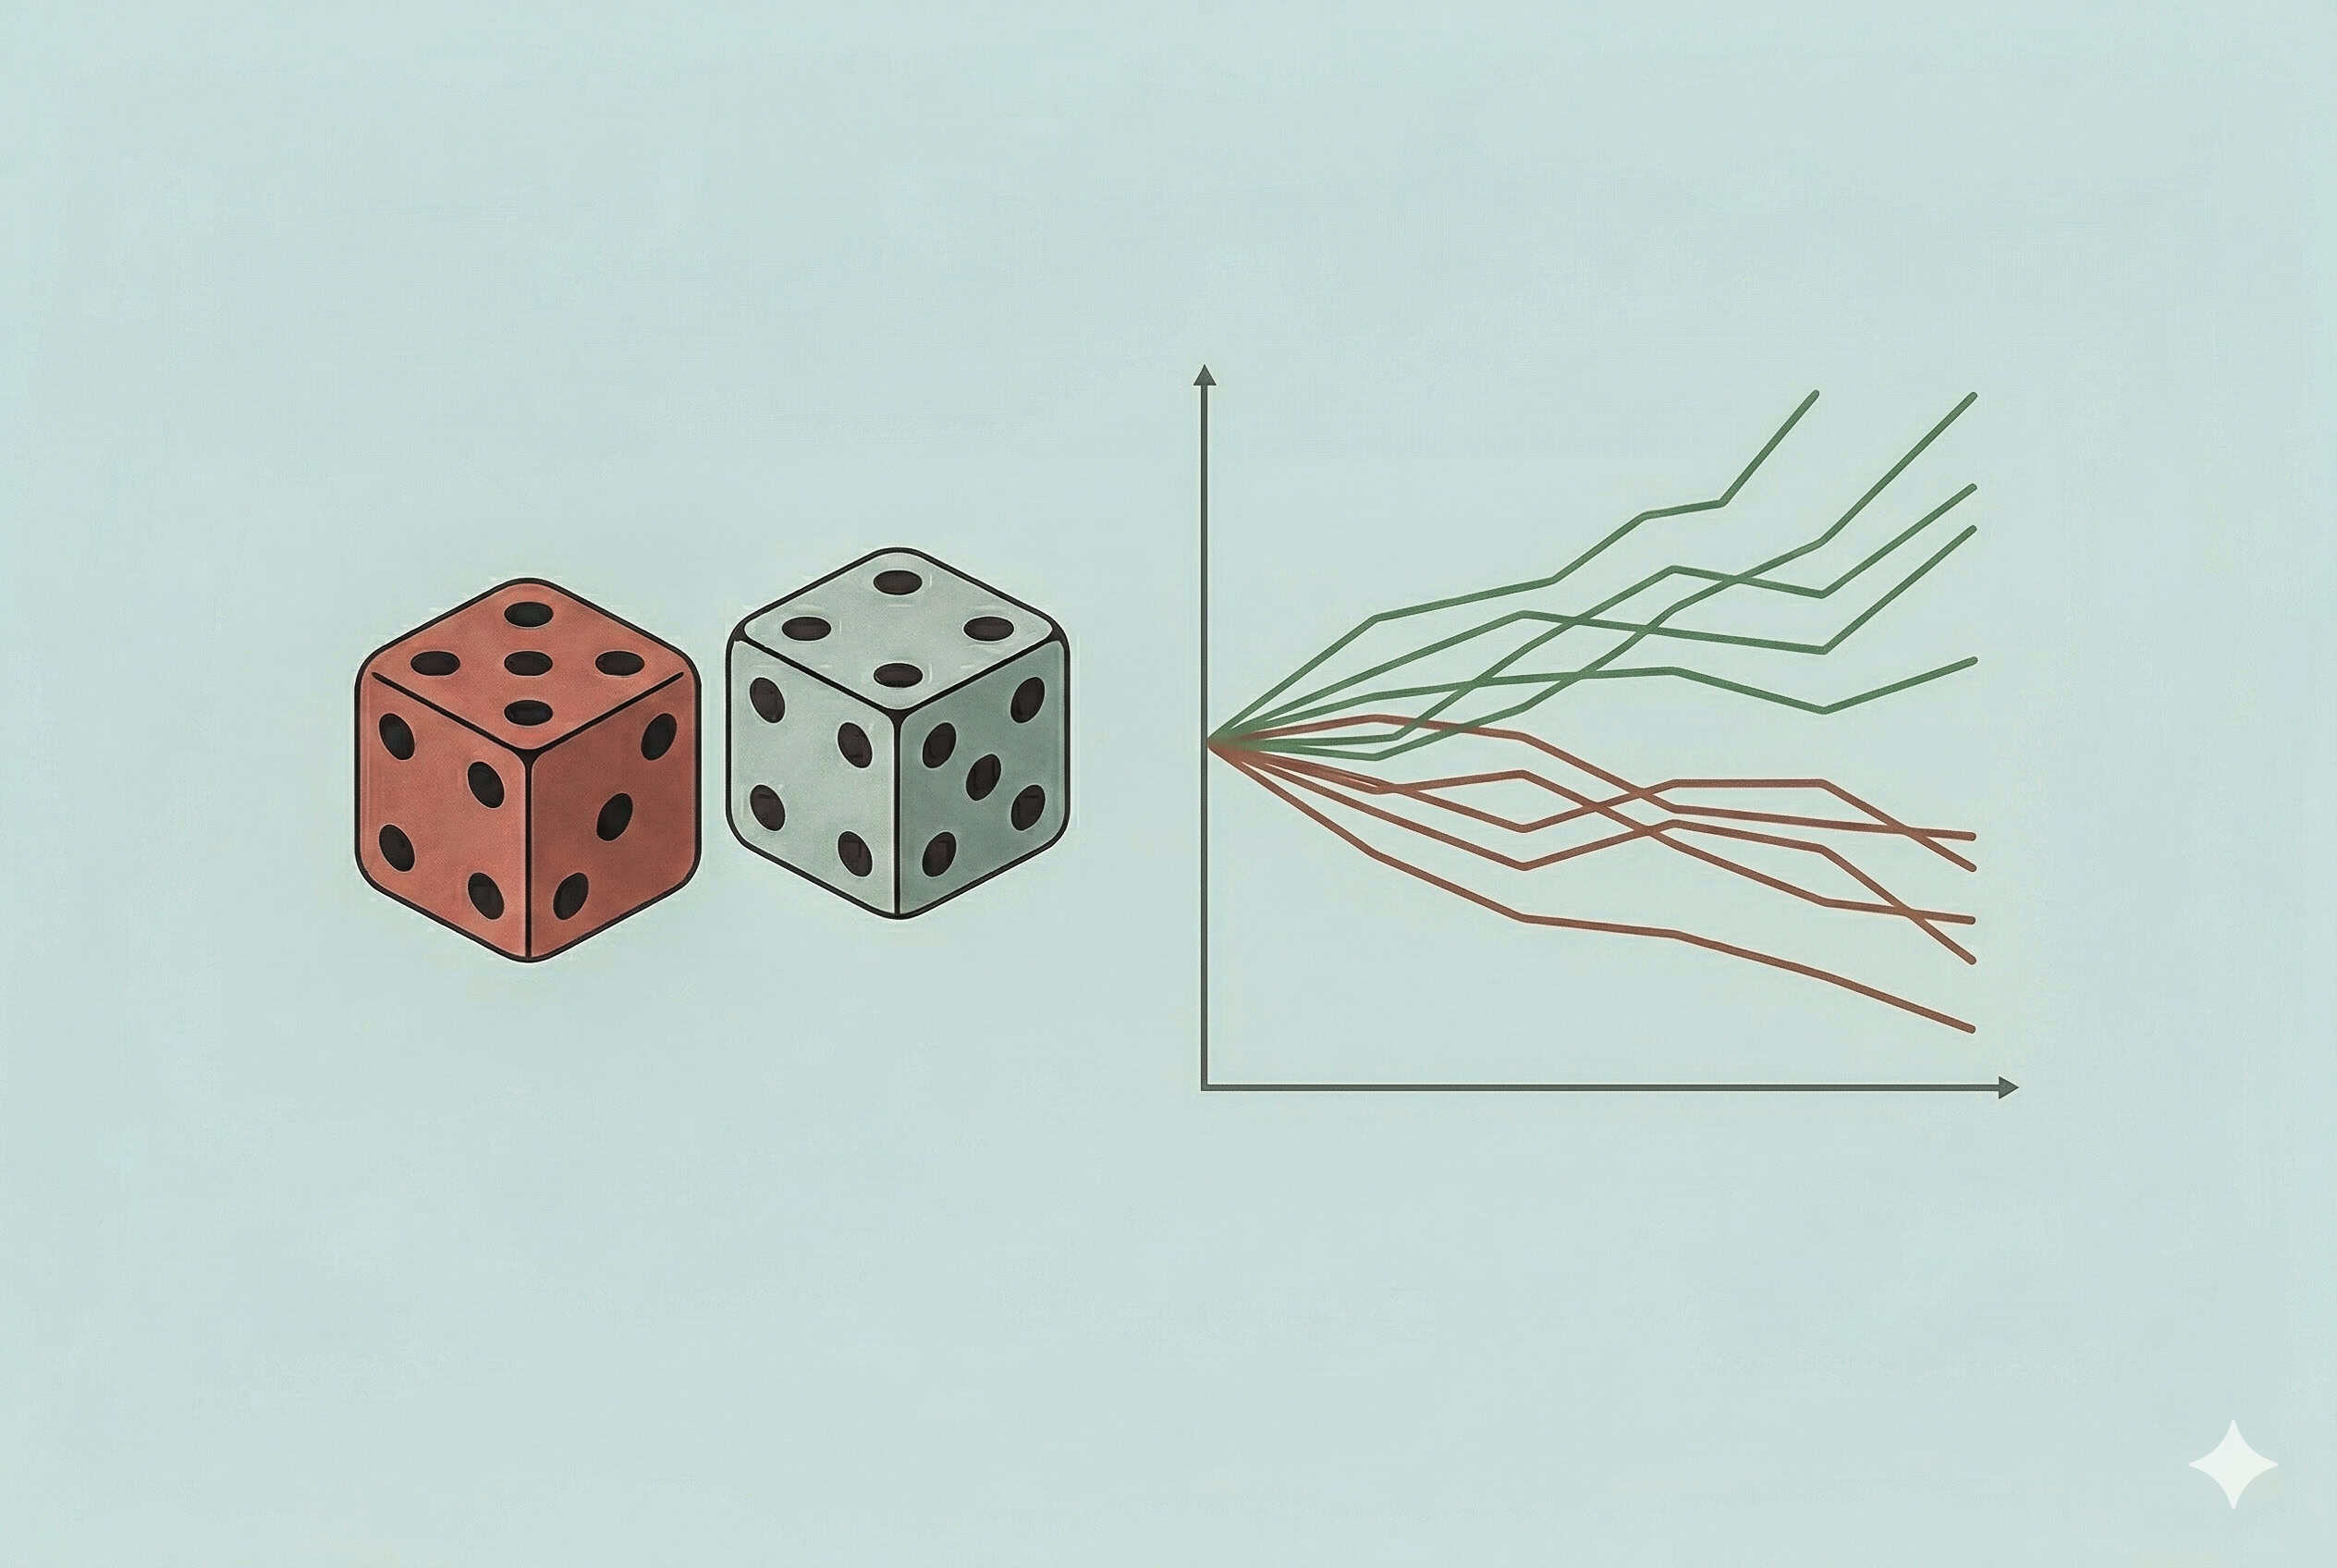
What the Equity Paths Tell You
The most powerful output of a Monte Carlo simulation is the equity path chart — hundreds of possible equity curves generated from the same trades in different orders.
When you look at this chart, you’re seeing the cone of uncertainty around your strategy. The narrow the cone, the more consistent your edge. The wider it is, the more your results depend on luck of sequencing.
How to Read the Cone of Uncertainty
A strategy with a genuine, robust edge will show most equity paths trending upward, even if some dip significantly along the way. A strategy that only worked because of a lucky sequence will show a wide spread — many paths ending below the starting capital.
This tool is for educational purposes only and does not constitute financial advice. Monte Carlo simulations are based on historical trade data and do not guarantee future results. Past performance is not indicative of future performance.
Position Sizing From Monte Carlo Results
The most direct application of Monte Carlo results is position sizing. Instead of sizing based on your historical drawdown, size based on your 95th percentile worst-case drawdown.
The logic: if your historical drawdown is 10% but your Monte Carlo 95th percentile is 25%, your position size should be calibrated to survive a 25% drawdown — not a 10% one. Anything else is assuming you’ll always get a lucky sequence.
A conservative approach: divide your maximum acceptable portfolio loss by the 95th percentile drawdown to get your scaling factor. If you can tolerate a 20% portfolio loss and your Monte Carlo 95th percentile is 25%, you should trade at 80% of your full position size.
What to Do With All This
Monte Carlo simulation doesn’t tell you whether your strategy will work. It tells you the range of outcomes you should expect if it does. That’s a different — and more honest — question.
A strategy that shows a 95th percentile drawdown of 15% and zero ruin probability across 10,000 simulations deserves more confidence than one showing a 40% worst case and 8% ruin probability — even if both have the same historical drawdown. The simulation reveals what the backtest hides.
Use the tool above with your own trade history. If the results are worse than you expected, that’s not bad news — it’s accurate news. And accurate information is the only foundation for decisions worth making.
References
- Metropolis, N., & Ulam, S. (1949). “The Monte Carlo Method.” Journal of the American Statistical Association, 44(247), 335–341.
- López de Prado, M. (2018). Advances in Financial Machine Learning. Wiley. Chapter 14: Backtest Statistics.
- Bailey, D. H., & López de Prado, M. (2014). “The Deflated Sharpe Ratio.” Journal of Portfolio Management, 40(5), 94–107. Available on SSRN: https://ssrn.com/abstract=2460551
- Vince, R. (1992). The Mathematics of Money Management. Wiley. Chapter on Monte Carlo simulation in trading.
- Chan, E. (2013). Algorithmic Trading: Winning Strategies and Their Rationale. Wiley. Chapter 3: Risk Management.

I’ve spent years trading crypto futures and building automated arbitrage systems across exchanges. I started Yieldova to share what, in my opinion, actually works in live markets. I’ve had losing streaks, blown strategies, and a few wins worth writing about. Everything here is based on real experience.